My Languages

SQL

SQL is the language of databases. Knowing how to use spatial extensions (PostGIS / BigQuery) within the database allows for spatial. Using SQL not only allows for better application design, but also for better analysis of data. I've included a code sample on the bottom of my dashboards page as an example of this work. Or want to see a behemoth of a query? Check out a view query I made for the Utah DNR to flatten an entire database here.

Python

Python is a backend language ideal for automations, custom tools, pipelines, and analytical workflows. Streamlining and standardizing workflows is critical in a collaborative environment. Building and running custom tools outside of software speeds up analysis. Automating the repetitive tasks frees the analyst up more time to do the important work. Web frameworks like Flask take it a step further bringing python code out of the console out into the world (like at the top of this page). See the bottom of this page for an ArcPy script example, see the bottom my bio page for an example of a python script toolbox of mine.

RStudio

RStudio is an integrated development environment (IDE) for R, a programming language for statistical computing. Popular for academic research, this language is the go to language for data science and statistical analysis. Check out the data science entry on my dashboards page for an example of a shiny application, or scroll down this page to my 'Species Distribution Modelling in the Cloud' entry.

JavaScript

JavaScript is the language of web browser. Having a good handle on this language is a prerequisite for anyone wanting to make custom web apps. For an advanced example check out the first entry on my dashboards page. Or for a code example check out the 3D webmap on my thesis page (code at the bottom of that page).

HTML5/CSS

How do you like this page? Although HTML isn't necessary for analysis, it is very useful to know on the front end. When you can display your data to the world in an intuitive way, then you are that much closer having your ideas well received. This website is hosted over Firebase and uses github actions for CI/CD.


Pipelining with Cloud Functions

This first Cloud Function is designed to pull data from a USGS API for invasive aquatic species, enrich this JSON using an ArcGIS Online feature service, and then send the resulting data to BigQuery.

Cloud Functions can also be used for ArcGIS Online (AGOL) feature enrichment. This next function pulls in several feature services from AGOL to enrich another, the resulting edits are then written back to AGOL. A separate cloud function (not shown here) is then used to pipeline the data to BigQuery.

In the case that there's a long running script that needs to be automated, Cloud Functions (v1) can only run for up to 15 minutes before timing out. Cloud Run and Cloud Functions (v2) can run for up to an hour. The only option for scripts that may need to run for up to 24 hours is App Engine. Writing automations here is a bit different. Shown here is a script I wrote to pipeline data from an Oracle database to BigQuery.


Building a bird survey app in Flask on App Engine

Shown here is an application I wrote in Flask. Flask is a web framework that provides libraries to build lightweight web applications in python. For this full stack web application, I am using flask on the backend to query and prep the data. On the front end I am using the JavaScript library Leaflet with some heavily customized tools I made for this app.

I made this application to fill a need of the bird surveying community. I frequently get asked to build web maps to aid in surveying efforts. I found I was frequently making the same maps in the same styling. This application delivers GeoJSON data to the front end where it is styled the same for different areas. You can find the whole story about the San Francisco Christmas Bird Count on my dashboards page.

I chose to host this application on the Google Cloud Platform (GCP) in its App Engine. This application can split into a maximum of 3 instances to handle light to medium traffic loads. Source code is stored on GitHub and CI/CD is used via a cloud build trigger to push new code. In the first survey season alone (Dec 14 2021 through January 5th 2022) this site had 369 unique users, with over 1000 site visits, and over 3800 site interactions. I made a live dashboard of this applications analytics using Looker Studio, check it out here:

The map above is a simplified example, please follow the link to experience full features.


Automating 3d modelling with Terraform

Open Drone Map (ODM) is opensource software for making orthomosaics and surface models out of drone footage. Shown here is a model I made in ODM on a virtual machine in Google Cloud. Because ODM is a very resource intensive program, it is better to only run this resource when needed. Because of this I decided to automate the deployment process in Terraform. Terraform is an open source infrastructure as code (IaC) software tool that allows DevOps engineers to automate deployments.

This model was built in a VM I deployed running on 128g of ram and 16 CPUs. At these specifications I was able to build this model in 3 hours out of 10 gigabytes of drone footage comprised of 709 photos. After building the orthomosaic and surface model in ODM, I destroyed the VM and moved the data to QGIS where I made the 3d interactive model. Check out the Terraform script in the repo below.

Try out a smaller, higher resolution, subset here.


Google Earth Engine

JavaScript for Analysis

Google Earth Engine is a fantastic tool for anyone with JavaScript experience. Shown here is a web application I put together to visualize change before and after the CZU Lightning Complex Fire swept through Big Basin Redwoods State Park in 2020. The image on the left is just before the fire (June 2020) and the image on the right is after fire, but exactly a year after the first image was acquired (June 2021). This is so we aren't comparing vegetation characteristics in different stages of the growth process. These images are from Sentinel 2 at a 10m resolution using the NIR band combination. This band combination is especially good at displaying vegetation health (in red). We can clearly see the destruction in these images.


Making an HTTP API in Python on GCP

An API is a great way to give access to a database where you can control what users are able to create, read, update, or delete (CRUD). To restrict users to only read access to my PostGres database I made a simple API in Flask and Python. This APIs purpose is to give the user access to filter United States counties by state and output a GeoJSON to use in their own projects. The need for this API arose out of a desire to de-clutter my projects and create one central hub for all of my admin boundaries. This API is optimized to work in the QGIS, Python, and R environments. This code is hosted on GitHub and CI/CD pipelines carry it to Google Clouds App Engine for serverless hosting. Documentation contained in the link below. Want to see it live in an application? Check it out here.


Connecting an HTTP API to a Map

Firebase Hosting is a Platform as a Service (PaaS) for hosting front-end apps. These types of apps can request real-time data from APIs. Here I am using the API I demoed above to serve vector polygons out of a database. I query the API for a random state, and display it in Leaflet. Click the text box in the upper right to see a new county.


Species Distribution Modelling in the Cloud

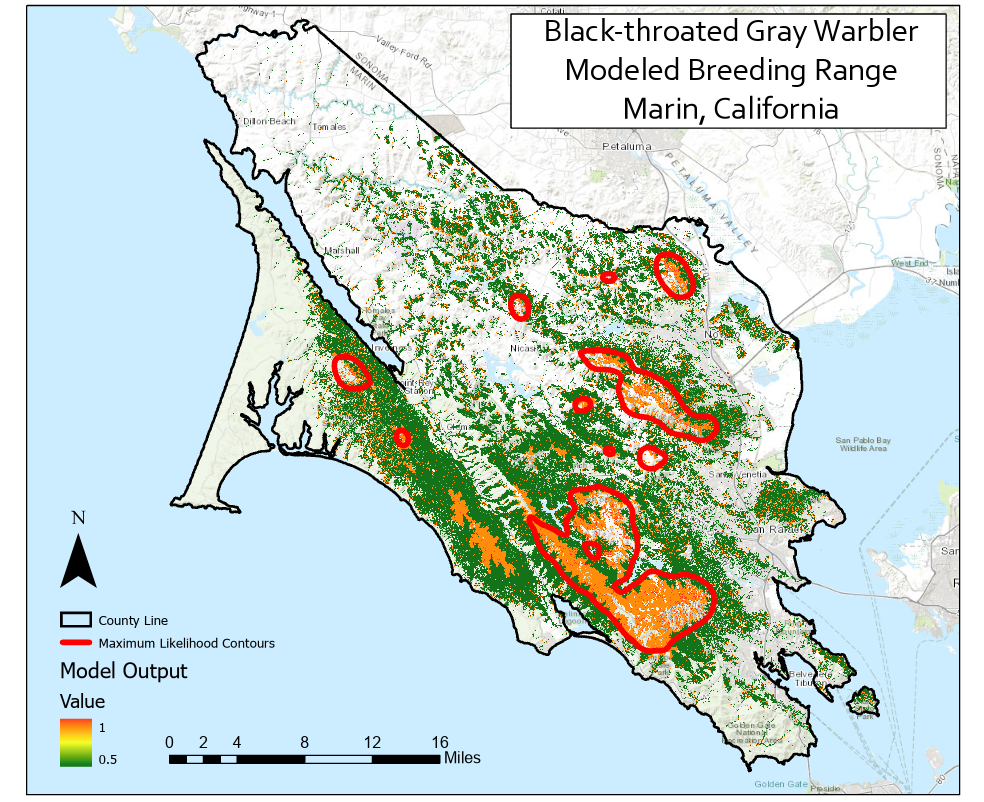
Designed for the Utah Department of Natural Resources, this Species Distribution Modelling (SDMs or SDHMs) R script is optimized to be ran in the cloud. SDMs require a very powerful desktop machine, or the ability to deploy code to Virtual Machines. I designed this script to be ran cloud native and to run on GCPs Vertex AI, a machine learning notebook environment for R and Python. Everything this script needs to run is self contained, including paths to Raster Stacks published to Cloud Storage to extract the environmental predictor co-variates out of. Check out the tutorial in the Read Me linked below.


React with Firebase / Firestore

Firebase is a platform developed by the Google Cloud Platform for creating mobile and web applications. It is a Platform-as-a-Service environment that allows developers to rapidly build, test, deploy, and scale applications in cloud. The native backend to Firebase is Firestore; a NoSQL, key-value, database known for its fast read-write speeds, automatic scaling, high performance, and ease of application development. Firebase will also handle user authentication, making development on this platform even more streamlined.

Shown here is an application I built in React, a front-end javascript framework. This app stores user data in key-value pairs, then nests subsequent todo entries within this JSON. This makes querying out user data super simple. This entire app is stored within Firebase and new features are easily pushed through a GitHub actions CI/CD connection.


Python Code Example

Shown here is an ArcPy script for creating a weighted sum with user defined inputs in ArcGIS Pro using portal items. It considers elevation, vegetation height, and vegetation type. To see a markdown file explaining this script please check out my markdown here: https://wwiskes.github.io/habitatFinder/

Get in touch

Any questions at all just drop me a line, I usually respond within a couple days.